
Q4 Update - Investment Strategy Committee Notes
ISC Model Updates:
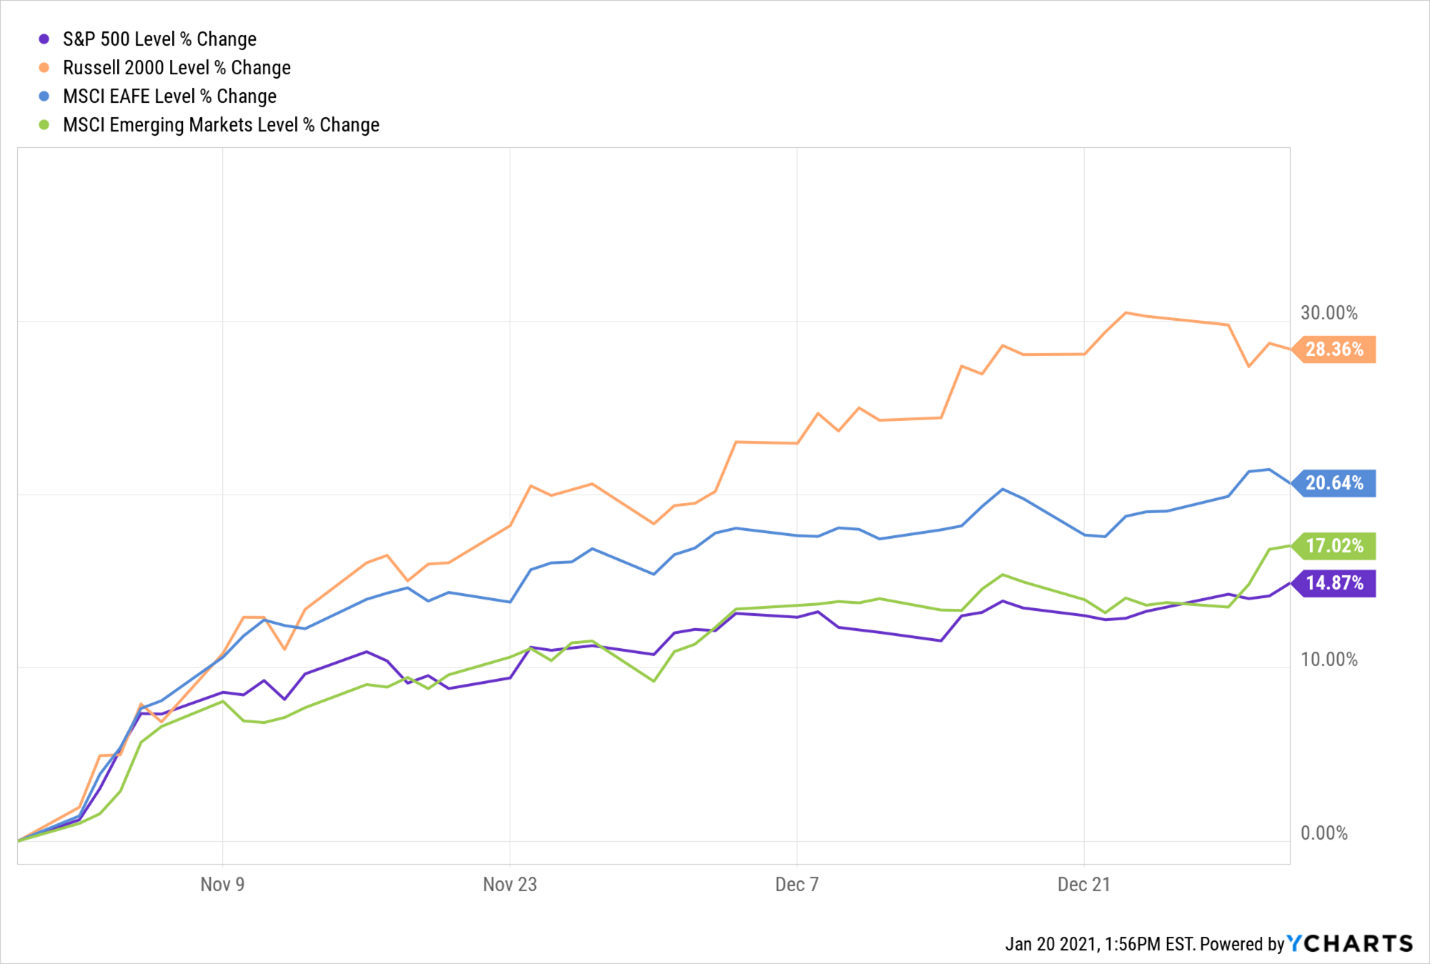
Equity markets ended the year with an exclamation mark closing at all-time highs and up double digits on the year for most major indices, a feat that seemed almost impossible in the darkest days of March.
Given the historic concentration in the market and the disproportionate impact the largest constituents were having on performance, the story of the 4th quarter was the broad nature of the rally, and with it, renewed discussions around the potential arrival of the fabled “rotation trade” with the mega-cap laden S&P 500 and Nasdaq 100 no longer leading the equity charge.
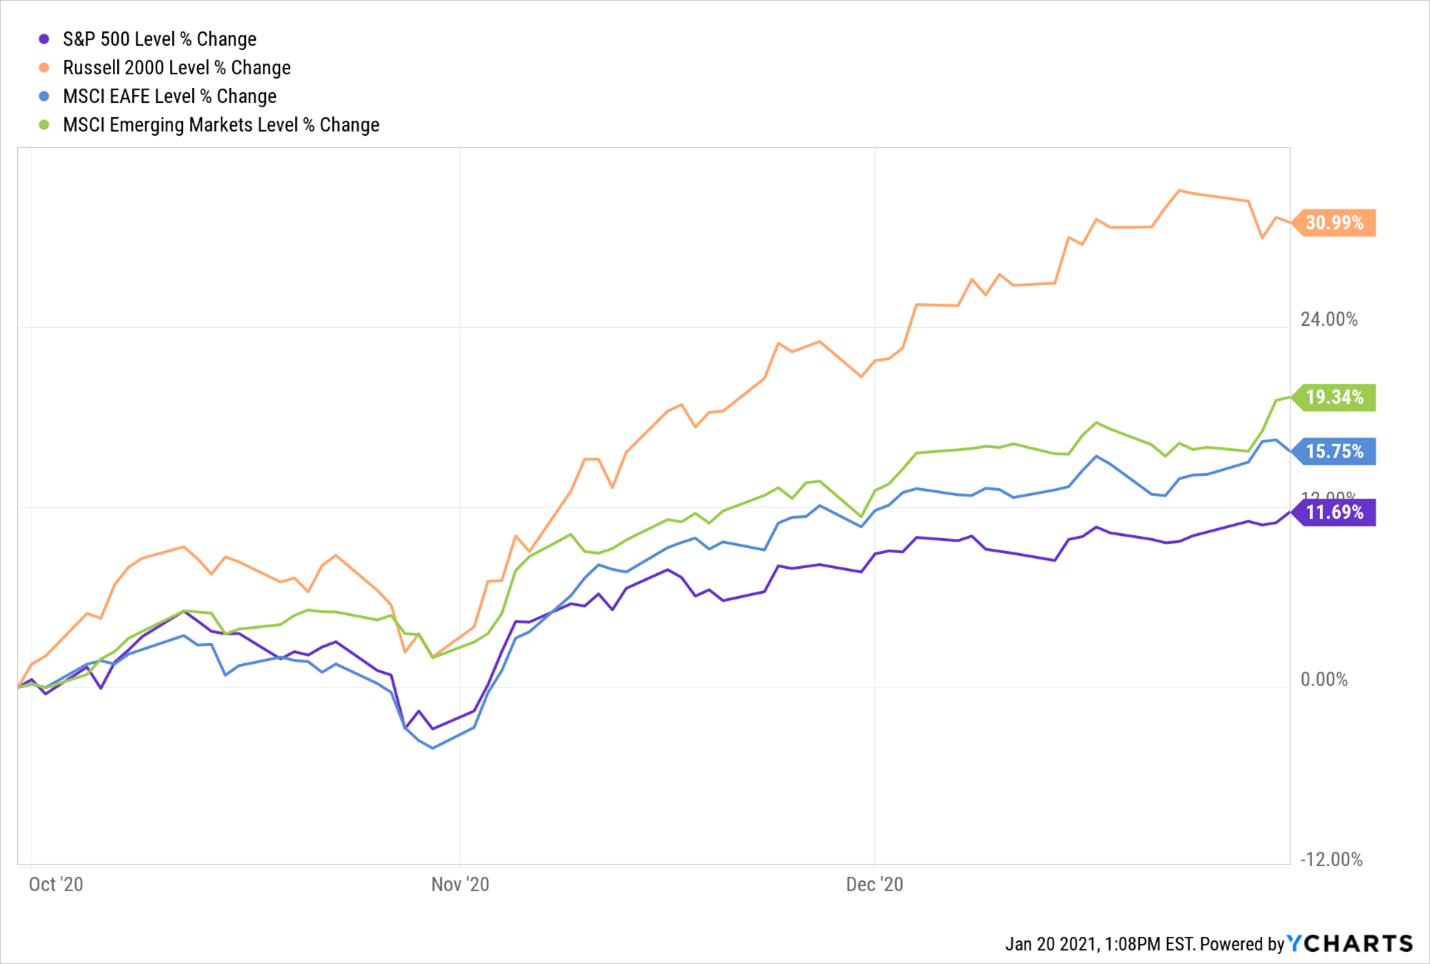
Once bitten, twice shy, however, so one could forgive the skeptics. There is perhaps a growing body of evidence to support the rotation fanfare.
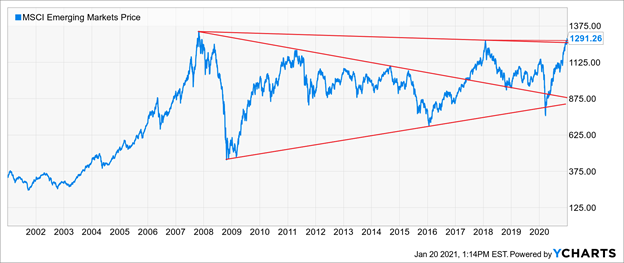
Emerging Markets look to be breaking out of a 13-year base.
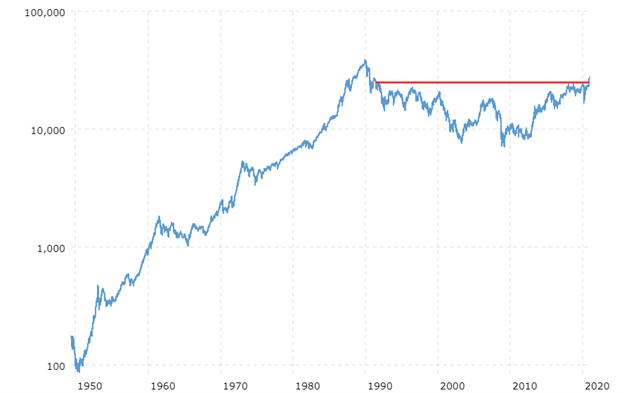
The Nikkei too has broken out to the highest levels since the early 1990s!
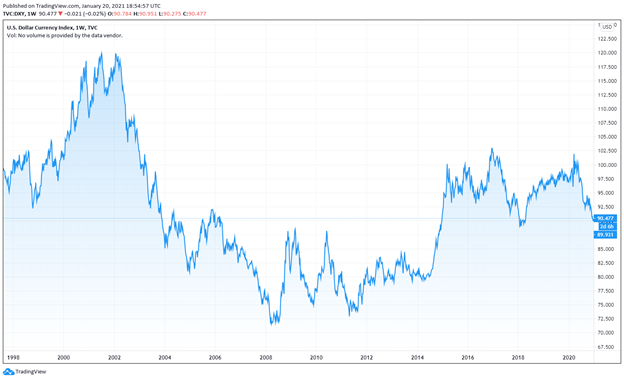
And this has all been on the back of the dollar near its lowest levels in over six years testing key support from early 2018.
Only the benefit of hindsight will resolve the debate, but the relative performance consequences are stark as discussed last quarter.
From the bottom in the commodity cycle in 1999 through 2008, the relative performance between major asset classes was stark. Emerging Markets more than quadrupled from their lows, and gold and commodity prices more than tripled into their 2008 peaks. While the S&P 500 roughly doubled from the lows to its eventual highs in 2007, it lagged other risk assets significantly.
A quarterly update without a discussion of the election would be wanting. By mid-October, markets began trading off with the S&P 500 heading toward the September lows and the VIX towards its highest levels since the early summer as seen in the two charts below. The resurgence in COVID-19 and concerns around renewed lockdowns globally were front and center. However, a significant amount of volatility was being priced into the market on and through the election which likely contributed as well.
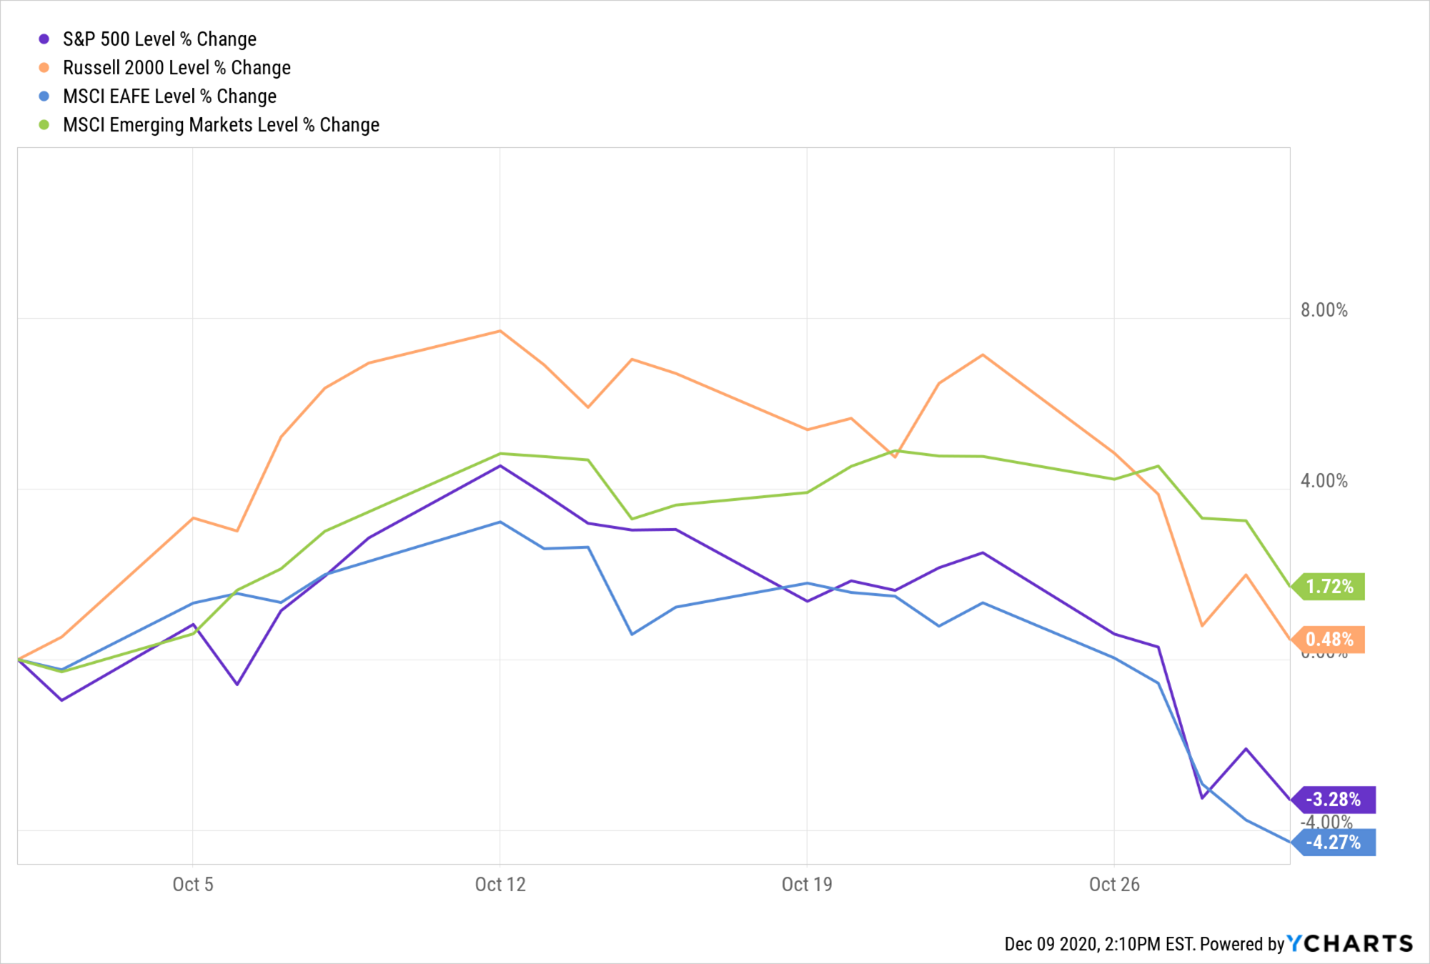
Given the high levels of volatility the markets had priced in, the actual event came and went without issue for asset prices. As the calendar turned to November, the markets quickly found their footing and never looked back. Channeling the immortal works of Donald Rumsfeld, the “known unknown” of a heated election was well telegraphed, and when the worse did not come to pass, those that hedged were likely left scrambling to quickly unwind those positions.
Disclosures
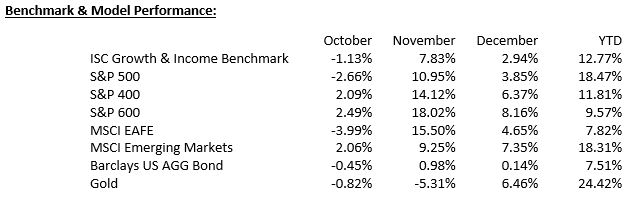
The ISC Growth & Income Benchmark is a blend of 33% S&P 500, 9.6% S&P 400, 2.4% S&P 600, 10.8% MSCI EAFE, 4.2% MSCI Emerging Markets, 37% Barclays Aggregate, and 3% Cash.
The opinions voiced in this material are for general information only and are not intended to provide specific advice or recommendations for any individual. All performance referenced is historical and is no guarantee of future results. All indices are unmanaged and may not be invested into directly.
The economic forecasts set forth in this material may not develop as predicted and there can be no guarantee that strategies promoted will be successful.
Investing in stock includes numerous specific risks including the fluctuation of dividend, loss of principal, and potential illiquidity of the investment in a falling market.
The prices of small and mid-cap stocks are generally more volatile than large-cap stocks.
Bonds are subject to market and interest rate risk if sold prior to maturity. Bond values will decline as interest rates rise and bonds are subject to availability and change in price.
The fast price swings in commodities and currencies will result in significant volatility in an investor’s holdings.
International investing involves special risks such as currency fluctuation and political instability and may not be suitable for all investors. These risks are often heightened for investments in emerging markets.
WCG Wealth Advisors, The Wealth Consulting Group, and LPL Financial are not affiliated with any of the entities referenced.
The S&P 500 Index is a capitalization-weighted index of 500 stocks designed to measure the performance of the broad domestic economy through chanced in the aggregate market value of 500 stocks representing all major industries
The S&P Midcap 400 Stock Index is an unmanaged index generally representative of the market for the stocks of mid-sized US companies.
The S&P SmallCap 600 Index is an unmanaged index generally representative of the market for the stocks of small-capitalization U.S. companies.
The MSCI EAFE Index is a free float-adjusted market capitalization index that is designed to measure the equity market performance of developed markets, excluding the US & Canada.
The MSCI EM (Emerging Markets) Index is a free float-adjusted market capitalization-weighted index that is designed to measure the equity market performance of the emerging market countries of the Americas, Europe, the Middle East, Africa, and Asia.
The Russell 2000 Index is an unmanaged index generally representative of the 2,000 smallest companies in the Russell 3000 index, which represents approximately 10% of the total market capitalization of the Russell 3000 Index.
The NASDAQ-100 is a capitalization-weighted stock market index made up of 103 equity securities issued by 100 of the largest non-financial companies listed on the Nasdaq stock market.
The Bloomberg Barclays U.S Aggregate Bond Index is an index of the U.S. investment-grade bond market, including both government and corporate bonds.
The Cboe Volatility Index, or VIX, is a real-time market index representing the market's expectations for volatility over the coming 30 days. Investors use the VIX to measure the level of risk, fear, or stress in the market when making investment decisions.